The Net Revenue Retention Trap: Why High NRR Masks Churn

Artificial Intelligence
August 14, 2026
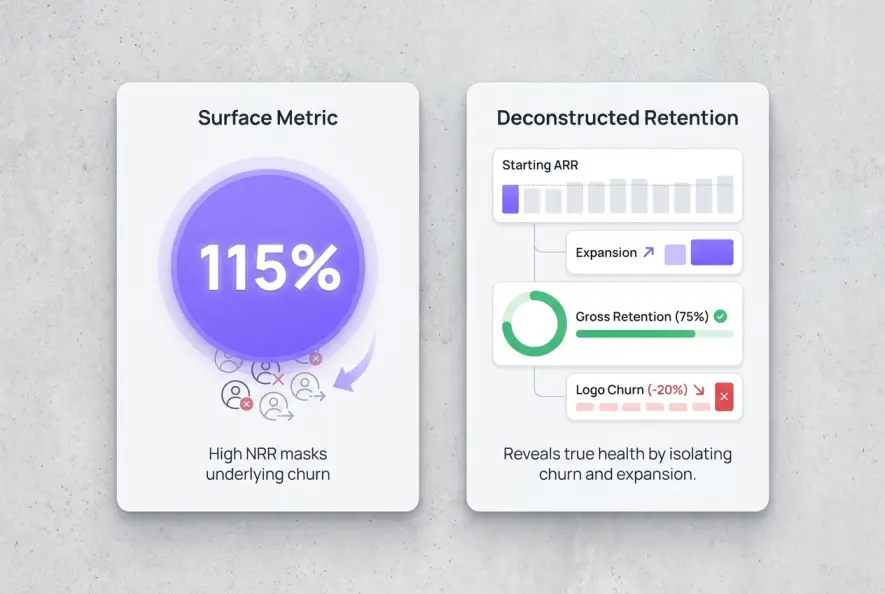
You present a board deck showing 115% net dollar expansion, and the room erupts in applause. The leadership team assumes product-market fit is dialed in, marketing accelerates acquisition spend, and sales focuses on upselling enterprise tiers. Six months later, ARR growth stalls unexpectedly because half your customer base quietly cancelled while three power users doubled their seat count.

The Net Revenue Retention trap occurs when heavy account expansion from a small subset of power users obscures systemic customer cancellations across the rest of your user base. Because the metric combines expansion revenue, seats added, down-sells, and outright cancellations into one high-level percentage, aggressive upsells can hide a leaking bucket. When top-tier expansion eventually caps out, the underlying logo decay exposes severe revenue vulnerability.
To build a durable subscription business, executives must look past headline expansion percentages and audit how that revenue is generated.
The Mathematical Illusion of High NRR
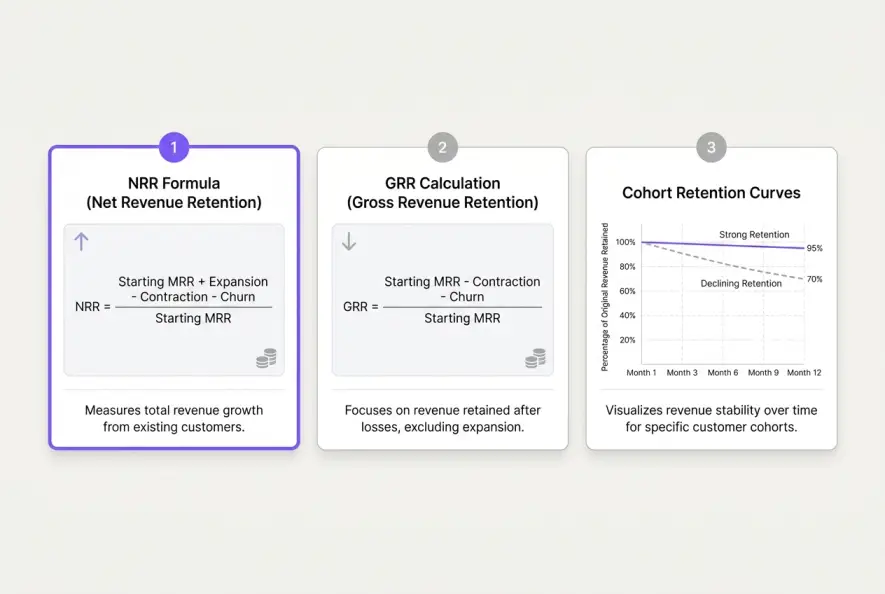
At its core, net expansion measures how much recurring revenue your existing customer cohort generates over a specific timeframe. The formula accounts for starting ARR, adds expansion and cross-sell revenue, and subtracts contractions and churn:
NRR = [(Starting ARR + Expansion - Contraction - Churn) / Starting ARR] * 100
While this metric is vital for evaluating company valuation, relying on it in isolation creates dangerous blind spots. A company can maintain an enviable 115% retention metric through two radically different operational realities.
Consider two B2B software companies, both entering the year with 10,000 average contract value):
| Operational Metric | Company A (Balanced) | Company B (The Trap) |
|---|---|---|
| Starting ARR | $1,000,000 | $1,000,000 |
| Starting Accounts | 100 | 100 |
| Expansion ARR | $200,000 (across 30 accounts) | $400,000 (across 5 enterprise accounts) |
| Contraction ARR | $20,000 | $50,000 |
| Churned ARR | $30,000 (3 logos) | $200,000 (20 logos) |
| Ending ARR | $1,150,000 | $1,150,000 |
| Net Revenue Retention | 115% | 115% |
| Gross Revenue Retention | 95% | 75% |
| Logo Retention Rate | 97% | 80% |
Company A displays sustainable organic expansion. Their product delivers broad value, churn remains minimal, and growth is distributed evenly across their base.
Company B is standing on a trapdoor. They lost 20% of their customer base in twelve months, yet reported identical headline retention figures because 5 enterprise accounts upgraded aggressively. Company B's leadership team might believe they have product-market fit, but they are actually burning through their total addressable market while over-relying on a handful of heavy spenders.
Relying on high-level expansion metrics without evaluating Gross Revenue Retention (GRR) allows enterprise upsells to hide mass customer dissatisfaction.
This exact scenario plays out when teams mistake revenue expansion for account health. When diagnosing underlying retention issues, fixing your customer churn rate is critical before relying solely on account expansion to mask structural product gaps.
3 Warning Signs Your Expansion Is Masking Decay
When executive teams treat net retention as a vanity metric, subtle signs of account decay go unnoticed until financial growth hits a wall. Understanding why high Net Revenue Retention can mask underlying product dissatisfaction is critical for sustainable growth.
1. High Account Concentration Risk
If 80% of your expansion ARR originates from fewer than 10% of your total accounts, your growth engine is fragile. Enterprise expansion naturally happens in large blocks—a enterprise client expanding from 500 to 2,000 seats creates a sudden spike in expansion ARR. However, if mid-market or SMB tiers are churning at 3% per month, those smaller accounts represent your future enterprise pipeline drying up.
2. A Widening Gap Between NRR and GRR
Gross Revenue Retention measures the percentage of recurring revenue retained from existing customers excluding expansion. Because GRR caps at 100%, it reflects pure retention performance. According to research from Bessemer Venture Partners, top-tier B2B software companies target GRR above 90%. When your net expansion stays above 120% while gross retention slides below 80%, expansion is acting as a bandage over a leaking bucket.
3. Price-Increase Distortion
Many subscription platforms mask volume churn by enacting annual 8% to 15% price increases. While contract price lifts boost expansion numbers on paper, they do not indicate increased software usage or improved user adoption. If usage intensity drops while account ARR rises due to mandatory price adjustments, client frustration increases, accelerating eventual contract non-renewals.
How Forced Expansion Distorts Customer Signals
Not all expansion revenue is created equal. Healthy account growth occurs when teams actively adopt additional features, add seats voluntarily, or upgrade tiers because the software creates undeniable operational value.
Unhealthy expansion happens when customers are forced into higher tiers due to restrictive feature gates or aggressive usage overage penalties. For instance, forcing a mid-sized client into an enterprise plan simply because they exceeded an arbitrary API call limit creates resentment. The account's ARR increases in the short term, driving up your net retention calculation, but the customer begins actively evaluating competitors.
Customer success software provider Gainsight highlights that account health scores should track product usage frequency alongside financial value. When financial expansion decouples from daily active usage, churn risk escalates rapidly.
A 4-Step Framework to Audit True Retention
To ensure your expansion numbers reflect genuine business durability rather than dangerous metric distortion, implement this operational audit framework across your executive reporting.
Step 1: Mandatory Dual-Reporting (NRR + GRR)
Never report net expansion without presenting Gross Revenue Retention directly alongside it. As defined by platforms like Klipfolio, tracking both metrics ensures leadership immediately sees when expansion is compensating for customer loss.
Step 2: Segment Cohorts by Account Tier and Age
Deconstruct cohort metrics by account size (SMB, Mid-Market, Enterprise) and customer tenure (Year 1, Year 2, Year 3+). SMB cohorts often display higher natural logo churn, but if Year 2 enterprise cohorts show declining gross retention, your product fails to retain value as accounts mature.
Step 3: Track Logo Retention alongside Revenue Metrics
While financial metrics measure dollar efficiency, logo retention measures market sentiment. Losing 30 small accounts while expanding 2 large accounts might look positive on a spreadsheet, but it signifies narrowing product appeal.
Step 4: Measure Usage Expansion Velocity
Audit seat utilization rates and feature adoption metrics prior to upsell conversations. Ensure accounts expanding their contract ARR are actively using at least 70% of their existing license capacity.
Establish an internal alert when any account's contract value increases while their weekly active user (WAU) metric declines. This divergence is the single strongest indicator of future contract cancellation.
Rebalancing Metrics for Sustainable Growth
Net retention remains one of the most powerful metrics in subscription business finance, but relying on it as a single source of truth creates dangerous operational blind spots. A high headline number can easily hide product flaws, poor onboarding workflows, and widespread logo loss behind a few large enterprise upsells.
By auditing Gross Revenue Retention alongside net expansion, tracking logo churn rates, and ensuring expansion reflects genuine usage growth, executive teams build durable businesses that withstand market shifts. Monitoring both Gross Retention and Net Revenue Retention gives executive teams a complete view of account durability, preventing unexpected revenue drops before they happen.
Artificial Intelligence
Intelligence without limits.
We believe great content deserves honest authorship—even when it's AI.
Frequently Asked Questions
For enterprise B2B SaaS companies, an NRR above 120% is considered world-class. For mid-market SaaS, 105% to 110% is healthy, while SMB-focused SaaS companies typically aim for 90% to 105% due to higher baseline logo churn.
GRR measures the percentage of recurring revenue retained from existing customers without including any expansion, cross-sells, or upsells. Because GRR cannot exceed 100%, it isolates churn and contraction to show true retention strength.
Yes. If customer acquisition costs (CAC) are extremely high or if logo churn is severe in lower tiers, high expansion from existing accounts can temporarily maintain revenue growth while underlying profitability and market share shrink.
Executive teams should review logo churn and revenue churn monthly during RevOps and Finance syncs, and perform deep cohort retention audits at the end of every quarter.
This usually indicates an ideal customer profile (ICP) mismatch. The product delivers exceptional value to enterprise power users (driving expansion) but fails to serve smaller or mid-market accounts (driving high logo churn).